Mechanical Specific Power (MSP) in Drilling -
Optimizing Power Utilization to Maximize Drilling Performance
Share Your Thoughts and Additional Information
Key Questions Answered in This Article
What is Mechanical Specific Power (MSP)?
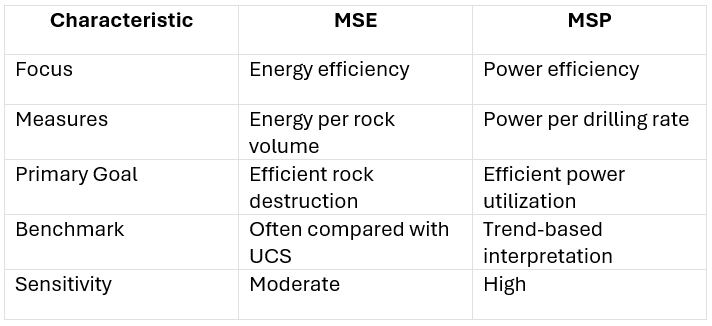
How is MSP different from Mechanical Specific Energy (MSE)?
Why is power utilization important in drilling operations?
How can MSP be used to improve drilling performance?
What operational problems can MSP reveal?
How can MSP help optimize WOB and RPM?
What are the limitations of MSP?
How should drilling teams interpret MSP trends?
How does MSP fit into a real-time optimization program?
Rationale for Introducing an Additional Optimization Metric
For decades, drilling optimization primarily focused on Weight on Bit (WOB), Rotary Speed (RPM), and later Mechanical Specific Energy (MSE).
MSE transformed drilling performance analysis by quantifying the energy required to remove rock. As drilling systems advanced, it became evident that understanding energy alone was insufficient for comprehensive optimization.
A drilling rig may achieve favorable MSE values while operating close to the limits of its power delivery capacity.
Likewise, two drilling systems may achieve identical ROPs while consuming significantly different amounts of power.
These findings prompted greater emphasis on evaluating drilling performance from a power utilization perspective.
Mechanical Specific Power (MSP) addresses this need by providing a metric focused on power utilization.
2. Understanding the Difference Between Energy and Power
Prior to discussing MSP, it is necessary to distinguish between the concepts of energy and power.
Energy
Energy represents the total work performed.
Examples:
Rock destruction
Formation cutting
Fracture creation
Power
Power represents the rate at which energy is delivered.
In simple terms:
Energy quantifies the total amount of work performed, whereas power measures the rate at which this work is accomplished.
This distinction is important because drilling is fundamentally a dynamic process.
The objective in drilling is not only to remove rock, but to do so at the highest sustainable rate.
3. What Is Mechanical Specific Power?
Mechanical Specific Power evaluates the power required to achieve a given drilling rate.
Instead of emphasizing energy per unit volume of rock removed, MSP evaluates the intensity of power consumption associated with drilling performance.
Conceptually:
MSP addresses the question: "How much drilling power is required to achieve the current rate of penetration (ROP)?"
A commonly used representation is:
MSP=2πNT+WOB⋅vROP
Where:
N = Rotary speed
T = Torque
WOB = Weight on Bit
v = Axial velocity
ROP = Rate of Penetration
Although different operators and software platforms may use variations of the calculation, the underlying methodology remains consistent.
4. Why MSP Matters in Modern Drilling
Modern drilling systems are ultimately constrained by available power.
Power limitations may originate from:
Top drive capacity
Rotary system capability
Mud pump horsepower
Downhole motor output
Turbine performance
Battery limitations in emerging electrified systems
While MSE focuses on drilling efficiency, MSP provides insight into how effectively the drilling system utilizes available power resources.
5. The Power Flow Path in a Drilling System
Understanding MSP is facilitated by visualizing the points at which power is consumed within the drilling system.
Surface power generated by the rig travels through:
Top drive or rotary table
Drillstring
Bottom Hole Assembly
Drill bit
Formation
Along the way, power can be lost through:
Mechanical friction
Drillstring contact
Hole cleaning inefficiencies
Vibrations
Poor bit engagement
Reactive torque fluctuations
MSP enables identification of scenarios in which excessive power is consumed without a proportional increase in drilling performance.
6. Practical Interpretation of MSP
In contrast to MSE, which is frequently compared to formation strength, MSP is primarily interpreted by analyzing its trends over time.
Low MSP
Generally indicates:
Efficient power utilization
Effective drilling conditions
Good energy transfer
Stable drilling process
Provided ROP remains acceptable.
High MSP
May indicate:
Excessive friction
Poor drilling efficiency
Vibration losses
Inefficient operating parameters
Mechanical limitations
A high MSP does not necessarily indicate poor drilling performance.
However, it indicates that maintaining the current drilling rate necessitates increased power expenditure.
7. MSP Versus MSE
These metrics should be regarded as complementary rather than mutually exclusive.
8. What MSP Reveals That MSE May Miss
Consider two drilling intervals.
Interval A
ROP = 100 ft/hr
Low power demand
Interval B
ROP = 100 ft/hr
Significantly higher power demand
MSE values may appear similar. MSP, however, immediately highlights the increased power consumption observed in Interval B.
This can reveal:
Developing inefficiencies
Equipment loading
Approaching operational limits
before substantial drilling performance degradation occurs.
9. Using MSP for Parameter Optimization
MSP can be extremely useful during drilling parameter sweeps.
Example
A drilling team gradually increases RPM. Initially:
ROP increases
MSP remains stable
Performance is improving efficiently. Eventually:
RPM continues increasing
ROP stabilizes
MSP rises significantly
The additional power input no longer results in significant improvements in drilling performance.
This often indicates the practical operating limit.
MSP and WOB Optimization
The same principle applies to Weight on Bit.
Increasing WOB generally improves cutter engagement.
However, beyond a certain point:
Friction increases
Torque increases
Vibrations increase
MSP rises rapidly
At this point, further increases in WOB typically yield diminishing returns.
MSP helps identify this threshold.
10. Field Applications of MSP
Application 1: Identifying Power Inefficiencies
MSP can identify instances in which increased power consumption does not result in improved drilling performance.
Common causes include:
Bit wear
Balling
Poor hydraulics
Excessive friction
Application 2: Monitoring Equipment Loading
MSP can help determine whether drilling systems are approaching equipment limitations.
Particularly useful for:
Top drives
Downhole motors
Turbines
Rotary steerable systems
Application 3: Optimizing High-Speed Drilling
In high-RPM drilling environments, MSP can identify the point where increasing rotary speed becomes inefficient.
Application 4: Extended-Reach Drilling
In ERD wells, friction losses become increasingly significant.
MSP can detect these losses earlier than rate of penetration (ROP) measurements alone.
Application 5: Real-Time Performance Surveillance
Real-time monitoring centers increasingly incorporate MSP alongside:
MSE
HMSE
Vibration measurements
to provide a more comprehensive assessment of drilling performance.
11. MSP and Drilling Vibrations
One of the most important applications of MSP is identifying vibration-related power losses.
Stick-Slip
Stick-slip causes repeated acceleration and deceleration cycles.
These cycles consume power without contributing to rock destruction.
Symptoms may include:
Rising MSP
Erratic torque
RPM fluctuations
Bit Bounce
Bit bounce introduces axial inefficiencies.
The rig continues to deliver power, although rock destruction occurs intermittently.
MSP often rises.
Whirl
Whirl generates substantial lateral energy losses.
These losses appear as increased power demand and elevated MSP values.
12. MSP and Bit Performance Monitoring
Bit deterioration frequently causes MSP to increase.
As cutters wear:
Cutting efficiency declines
More torque is required
More power is consumed
Monitoring MSP trends can provide early warning of:
Dull cutters
Damaged cutters
Bearing wear
Bit balling
13. Troubleshooting Guide
Scenario 1
MSP Rising While ROP Remains Constant
Possible causes:
Increasing friction
Bit wear
Developing vibration issues
Recommended actions:
Review vibration data
Review torque trends
Evaluate bit condition
Scenario 2
MSP Rising While ROP Falls
Possible causes:
Severe inefficiency
Hole cleaning issues
Bit damage
Formation transition
Recommended actions:
Investigate hydraulics
Review cuttings returns
Evaluate downhole measurements
Scenario 3
MSP Stable While ROP Increases
This typically indicates an improvement in drilling efficiency.
Continue monitoring.
Scenario 4
MSP Drops Suddenly
Possible causes:
Reduced formation strength
Loss of weight transfer
Sensor errors
Downhole tool failure or malfunction
Verification is recommended prior to implementing any parameter changes.
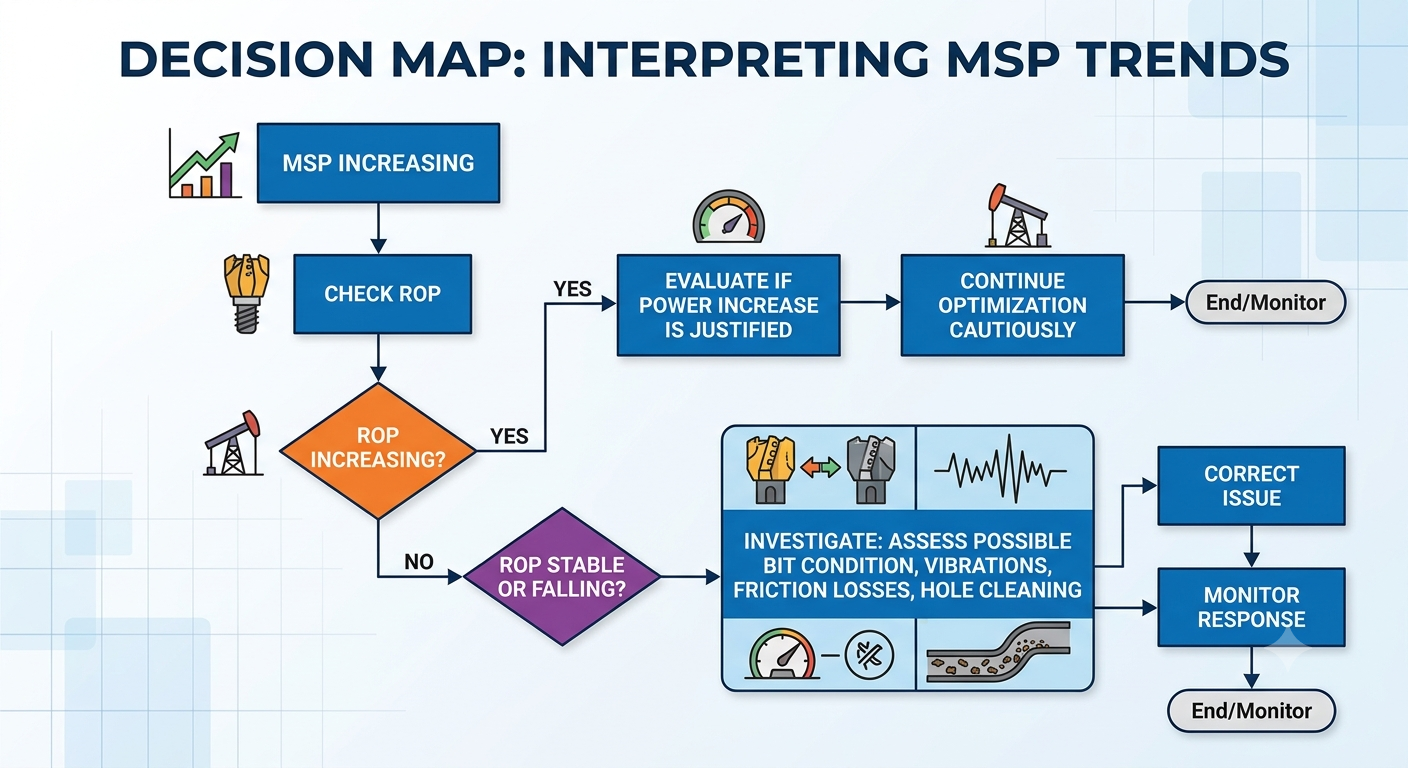
14. Decision Map: Interpreting MSP Trends
15. Limitations of MSP
Although MSP is a valuable metric, it should not be utilized in isolation. The limitations of MSP approach alone are indicated below:
No Direct Rock Strength Comparison: Unlike MSE, MSP is not typically compared directly to UCS.
Sensitive to Measurement Quality:
Accurate torque and RPM measurements are essential.
Inaccurate or poor-quality data can distort MSP calculations.
Does Not Fully Capture Hydraulic Effects: Hydraulic contributions require HMSE analysis.
Interpretation Often Requires Context: MSP trends should always be evaluated alongside:
Formation characteristics
MSE
HMSE
Vibration measurements
16. Best Practices for Using MSP
Do
✔ Monitor trends continuously
✔ Combine MSP with MSE
✔ Evaluate vibration data simultaneously
✔ Use during parameter optimization
✔Watch for sudden changes
Avoid
✘ Using MSP as the sole performance indicator
✘ Ignoring hydraulic limitations
✘ Focusing only on absolute values
✘ Making major parameter changes without supporting data
17. Frequently Asked Questions
Is MSP replacing MSE?
No. MSP complements MSE. The two metrics evaluate different aspects of drilling performance.
Can MSP improve ROP?
Indirectly, yes. MSP helps identify inefficient operating conditions and optimize power utilization.
Is MSP useful for directional drilling?
Yes. It is particularly useful in long laterals and extended-reach wells where friction losses become significant.
Does a lower MSP always mean better drilling?
Not necessarily. MSP must be considered alongside ROP and overall drilling objectives.
Why is MSP becoming more popular?
As drilling automation and real-time optimization systems become more sophisticated, understanding power utilization becomes increasingly important.
Key Takeaways
MSP evaluates the power required to achieve a given drilling rate.
It provides a power-efficiency perspective that complements MSE.
MSP is highly sensitive to operational changes and drilling dysfunctions.
Rising MSP often indicates increasing inefficiencies, friction, or vibration losses.
MSP is particularly valuable for parameter optimization and equipment loading assessment.
The greatest value is realized when MSP is integrated with MSE, HMSE, and vibration monitoring.
Modern drilling optimization programs increasingly use MSP as an early-warning indicator for performance deterioration.
References
Teale, R. 1965. "The Concept of Specific Energy in Rock Drilling." International Journal of Rock Mechanics and Mining Sciences 2 (1): 57–73.
Dupriest, F.E. and Koederitz, W.L. 2005. "Maximizing Drill Rates with Real-Time Surveillance of Mechanical Specific Energy." SPE/IADC Drilling Conference. SPE 92194.
Mitchell, R.F. and Miska, S.Z. 2011. Fundamentals of Drilling Engineering. SPE Textbook Series.
Bourgoyne, A.T., Millheim, K.K., Chenevert, M.E., and Young, F.S. 1991. Applied Drilling Engineering. SPE Textbook Series Vol. 2.
IADC. IADC Drilling Manual, 13th Edition.